
Management Systems
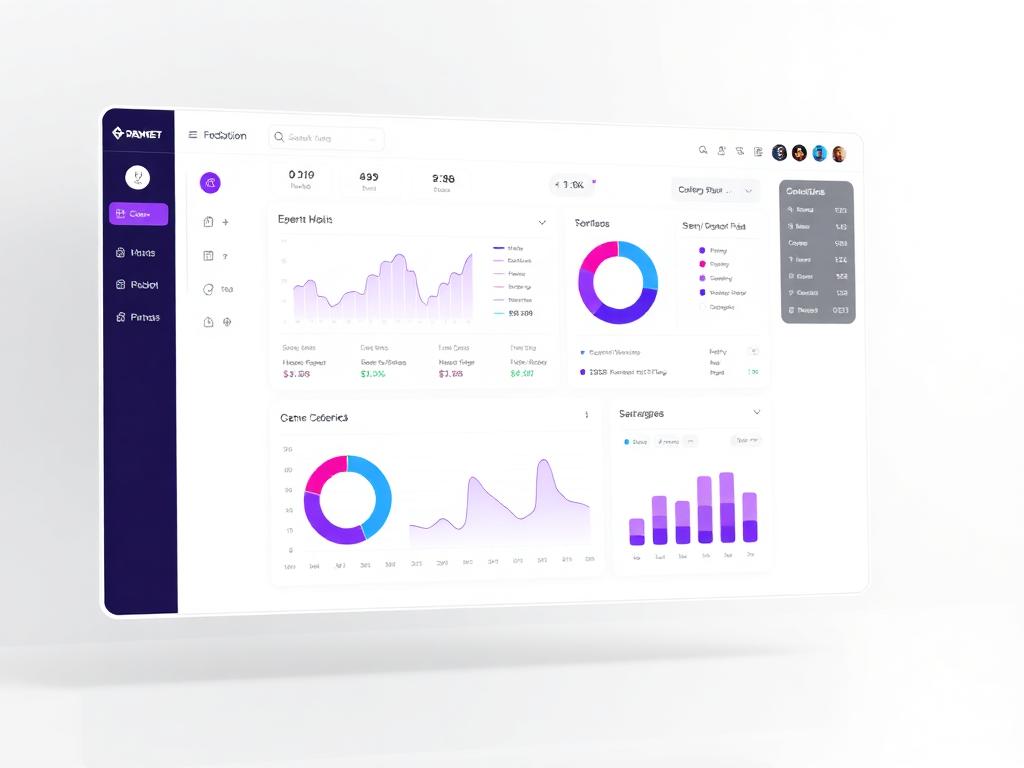
Pulse Analytics Platform
ReactTypeScriptRechartsTailwind CSSFramer Motion
The Challenge
Problem & Objectives
Organizations struggle to aggregate fragmented telemetry data across microservices into actionable real-time business insights.
The Engineering
Solution Overview
Functionality
Key Features & System Capabilities
Feature 1
Real-time KPI streaming
Feature 2
Customizable grid layout
Feature 3
Cross-metric correlation charts
Feature 4
Multi-tenant role permissions
Feature 5
Automated PDF/CSV export
Technical Blueprint
System Diagrams & Architecture
Analytics Data Pipeline Diagram
Ingestion layer to visualization engine conceptual structure.
1. Data Ingestion & Telemetry
Telemetry Engine
Live Polling Adapter
Gathers high-frequency operational metrics
Buffer & Normalizer
Prepares data streams for zero-lag rendering
2. Aggregation & Processing
Metric Correlation Engine
Threshold Evaluator
Monitors customizable KPI thresholds
Time-Series Aggregator
Computes trendlines and rollups
3. Interactive Dashboard Canvas
Visualization Layer
Responsive Chart Grid
Interactive zoom, filter, and comparison views
Export Manager
Generates PDF and CSV summaries
Service Alignment
Explore Data Analytics & Dashboard Systems Explore Data Analytics & Dashboard Systems
Learn how GJ Nexora Technologies applies these technologies to build custom solutions.